


Using Sliceline to Spot ML Model Errors
In a previous blog post, DataDome’s data science team presented Sliceline, an open-source Python package designed for machine learning (ML) model debugging.
Sliceline Applications on Open-Source Datasets
We announced that we would present an application of Sliceline on a well-known dataset called Titanic, which we did. But we didn’t stop there. We also applied Sliceline to the California Housing dataset from the popular scikit-learn library.
We selected those 2 datasets because they have been designed for 2 different machine learning tasks:
- Supervised Classification (Titanic): The model predicts the class to which each instance belongs.
- Supervised Regression (California Housing): The model predicts a number for each instance.
For each dataset, Sliceline helps us identify subpopulations on which our ML model is struggling.
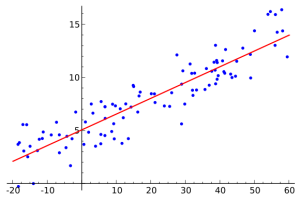
Illustration of a linear regression on a dataset.
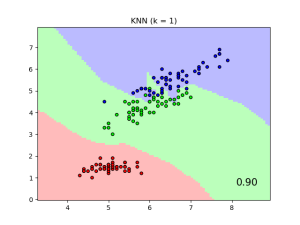
Illustration of a classification model (K-Nearest Neighbors) on a dataset.
Supervised Classification (Titanic)
The Titanic dataset is composed of 1,309 passengers records with the characteristics: age, sex, number of children in the boat, etc. You can find all the details regarding the columns of the dataset here.
The dataset also contains critical information: whether passengers survived the Titanic tragedy or not.
So from the dataset, one can try to build a model to predict if a passenger would have survived or not based on the passenger’s information.To conduct our study, DataDome’s data science team built a straightforward pipeline using a random forest classifier for prediction with default parameters. In our analysis, we do not focus on creating the best AI model of all time, but on analyzing our model’s errors.
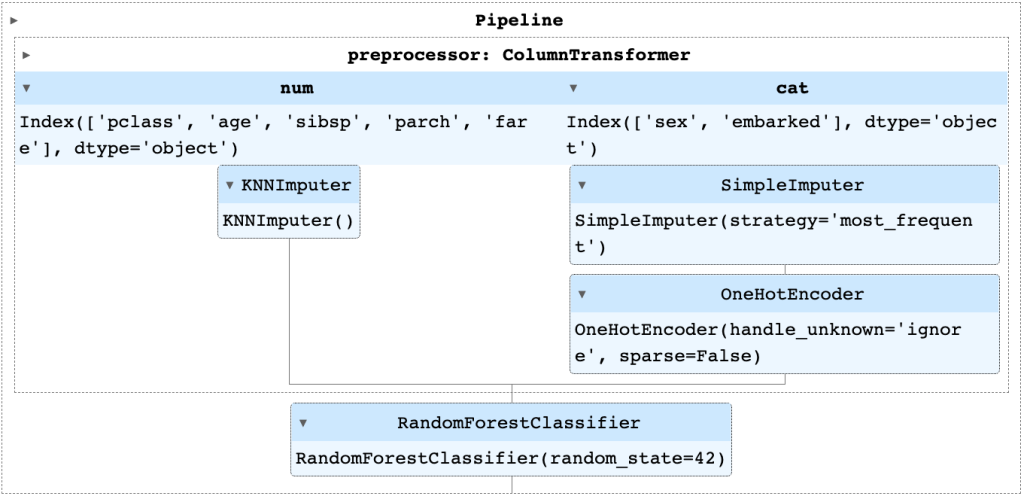
The full pipeline used in our Titanic example:
– Unknown values in numerical and categorical variables are both imputed, but with different strategies.
– Then categorical features are one-hot encoded so that the random forest can process the data.
The pipeline above estimated the score of each passenger to survive, allowing us to compute the element-wise log loss as our model training error for each passenger. The lower the log loss/model training error metric is, the better the model.
By feeding Sliceline with the training dataset and the element-wise training errors, we are able to identify where the model is significantly underperforming.
The hardest slice to predict for the model is a subset of 38 passengers who:
- Were in third class.
- Were 39.5 years old or more.
- Did not have parents or children aboard.
- And embarked in Queenstown.
The model log loss on the full dataset is 0.14. On this slice, it is 0.50.
To improve the modelization, we should focus on reducing the error on the above subset of 38 passengers. One possible way could be to add or create new features to help the model differentiate the error on this slice.
Supervised Regression (California Housing)
The California housing dataset is another famous open dataset designed for ML. Similar to the Titanic dataset, you can try to predict house values in California based on house characteristics.
We used the HistGradientBoostingRegressor from scikit-learn as an estimator and the Root Mean Square Error (RMSE) as the performance metric. Similar to the log loss error: the lower, the better.
On the full dataset (20,640 houses), the training RMSE is 0.16.
The slice on which our model is struggling the most to make predictions is the houses that count two or fewer average number of household members. The slice represents 1,756 houses and the average RMSE is 0.37.
Note that the slice found in the California housing dataset is composed of only one criterion, while the Titanic model’s slice was composed of four criteria.
For a deeper understanding of the California housing dataset, have a look at this scikit-learn analysis. We made our code open-source to let curious readers explore implementation details:
Conclusion
In this article, we applied Sliceline on two famous ML datasets. We successfully identified subpopulations where our supervised ML models performed significantly worse than they did on the full datasets.
Slices were defined in an intelligible way—with contrast sets, which are rules defined by a set of terms. In the next article of this series, we will explore an application of Sliceline in a security context and deep dive into Sliceline configuration and subtleties.

Related posts

The Agentic Threats & Industry Trends Defining 2026 (So Far)
Tell me more

Attacks on Sports-Betting Platforms Ramp Up Amid 2026 FIFA World Cup
Tell me more

Libération Leverages DataDome + Arc XP to Neutralize Malicious AI Scraping in <2 Milliseconds
Tell me more

Introducing Proof of Browser: How DataDome Blocked 14 Million Bypass Attempts
Tell me more

