


Effective Bot Traffic Protection: DataDome Releases New Dashboard
We’re excited to introduce you to the new, improved & enriched DataDome dashboard, version 4.0!Why mess with a good thing, you say? Glad you asked — we’ve collected, over the past year, extensive feedback from our users, and received lots of valuable input on how to facilitate your bot traffic management even further.The governing principle behind this new dashboard is that you need tools not only to block OWASP automated threats, but also to manage incoming traffic. You need powerful artificial intelligence (AI) to protect your website, your mobile app and/or your APIs in real time, but you also need tools to monitor, control and even override the AI to fine-tune your traffic security.
With an expanded menu, clearer navigation and above all, new KPIs to better measure performance and actions, the 4.0 dashboard is a major step in this direction.
Without further ado, let’s take a look at all the improvements we’ve made!
The homepage: all your KPIs at a glance
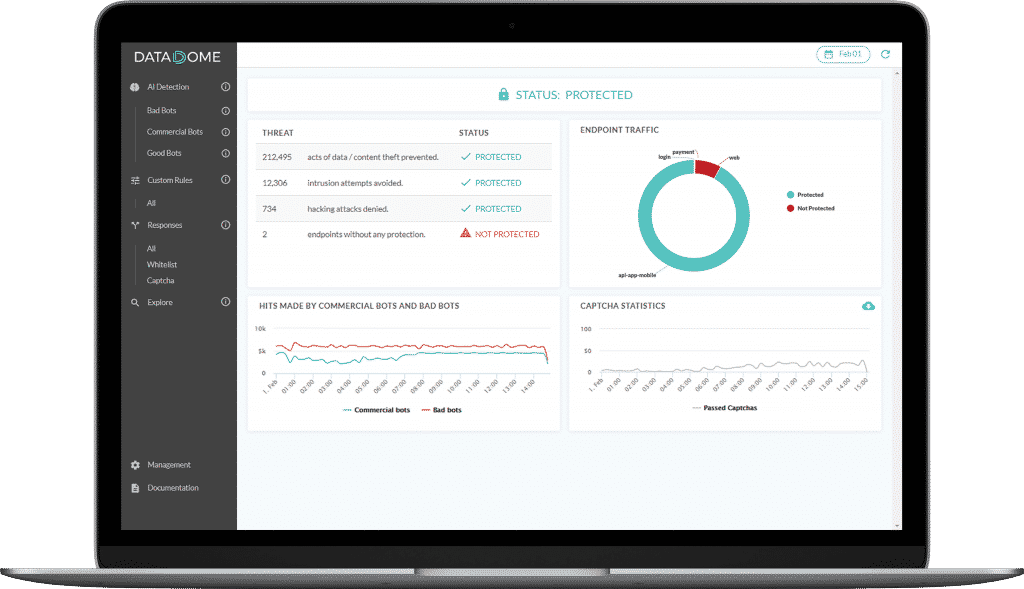
The dashboard homepage gives you a quick overview over the most important KPIs when it comes to bot management. Depending on your subscription level, you can view bot traffic data from the last 7 or 30 days.
The Threats graph shows the impact of bot traffic on your infrastructure resources, and exposes data or content theft attempts, intrusion attempts and hacking attempts.
The Endpoint traffic graph breaks down bot traffic by endpoint and by type of bots. By mousing over the graph, you can see the number of hits per endpoint.
The Hits made by commercial bots and bad bots graph is self-explanatory, while the CAPTCHA statistics graph enables you to assess the rate of false positives and thereby the quality of the AI detection.
From threats to responses
The menu on the left-hand side of the dashboard has been reorganized to reflect the different tools you have at your disposal in order to optimize your bot protection.
AI Detection

The DataDome module uses artificial intelligence to analyze 100% of your incoming traffic, to all your endpoints, in real time.
The AI Detection dashboard page displays data on all the bots that are detected by the DataDome module:
- Split of human traffic vs bot traffic
- Split between different types of bots: good bots, bad bots, commercial bots
- Bad bot activity split by type (scrapers, impersonators, …)
- Commercial bot activity by type
Custom Rules
The DataDome AI is powerful, but sometimes you may want to tweak it in order to perfectly customize it to your needs.
Custom Rules is probably one of the most important section of the 4.0 Dashboard. Indeed, as explained in our dedicated article, being able to override the AI and fine-tuning it according to your own needs is crucial when it comes to bot management. The Custom Rules function therefore benefits from a whole new, dedicated section, which occupies a central place in this new version of the dashboard.
The Custom Rules section is where you are able to override the AI Detection to micromanage incoming traffic to any of your endpoints.
Once they’ve been created, your own Custom Rules are listed here: block-listed bots, allow-listed partners, and any other rule that you want to apply to your traffic (bots AND humans).
Responses
Managing your traffic means defining a response policy (allow-list or CAPTCHA) depending on the results of the AI Detection, your Custom Rules, or the endpoint where the traffic is headed.
Of course, you can choose to let DataDome’s AI and machine learning process pick the right response according to the threat. As we continue to add new responses (rate limiting, hard blocking…), you will find them all here.
Explore
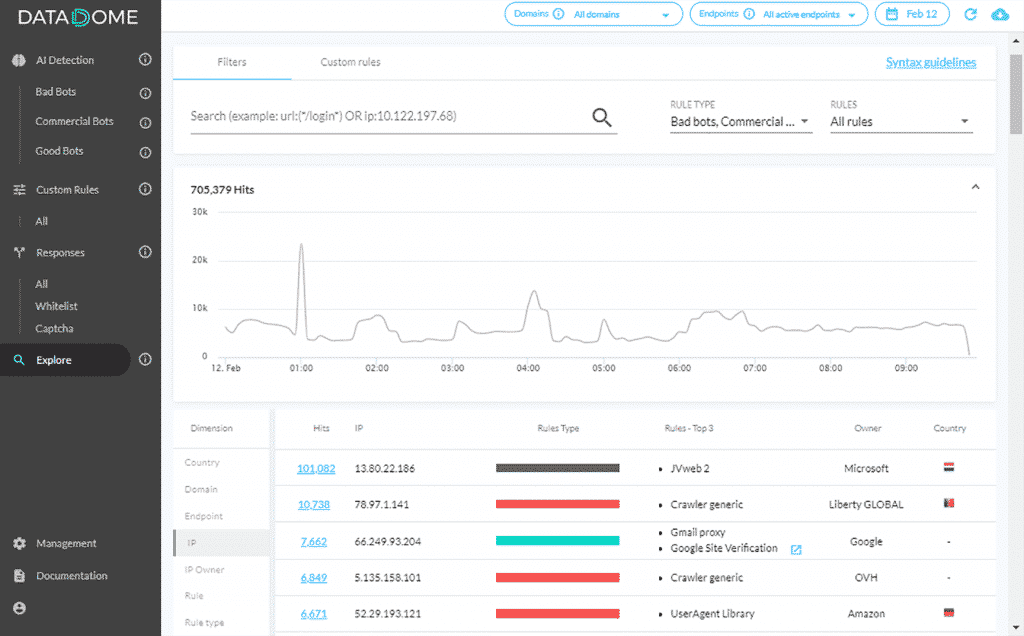
The Explore view allows you to dig deeper into your traffic analysis using up to 13 different filters, called Dimensions.
The main changes here concern three dimensions which have either changed or been deactivated:
- Bot Family is now Rule Type and gathers both the Custom & AI Detection
- BotName is now Rule
- BotType has been deprecated
Read more: Set out to discover your bot traffic
New features
The Dashboard 4.0 also includes a series of new features. Here is a quick overview:
Look-up feature
Do you remember how it used to be a pain to look for a certain bot? You had to search per category to find the one you were looking for – and that could take some time. This problem is now solved.
The look-up feature is available in every category. By simply typing the name of the bot, you can easily see if a Custom Rule is applied to that particular bot, and edit the Rule if needed.
New KPIs
Performance is at the heart of every business, and we have designed the new dashboard with this mantra in mind. Therefore, on each and every page of the dashboard, you’ll find new KPIs per category.
To mention but a few examples: bad bot pains, commercial bot type, allow- or block-listed hits per category, and CAPTCHA hits.
Introduction of the “Human” filter dimension
We have introduced, for the 1st time ever, the Human dimension in our module. It means that when applying a Custom Rule on your endpoint, you’ll be able to have an overview on the way human traffic will be impacted by this particular rule.
Summary
We hope you’ll enjoy this new version of the DataDome dashboard, which provides you with much more information than before and gives you a higher degree of control over your bot protection setup.
Customer feedback is very important for us, and we would love to hear what you think about the new dashboard and any new features that you would like to see implemented. Reach out to your usual DataDome contact, or simply leave us a note via our Contact form.
Related posts
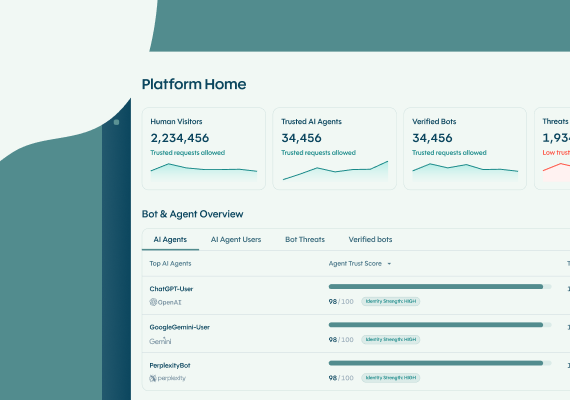
The DataDome Homepage: Your Command Center for Trust & Control
Tell me more
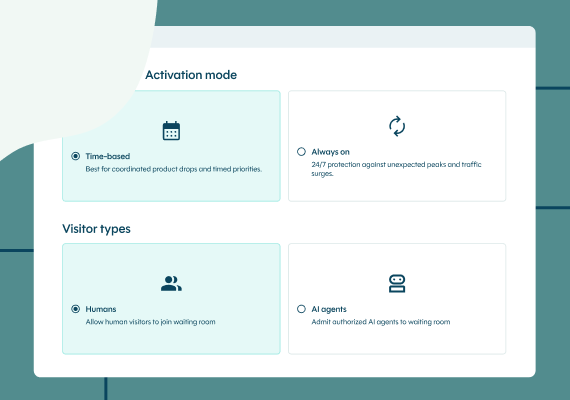
Introducing Priority Protect: The Only Virtual Waiting Room Built for the Agentic Era
Tell me more

Agent Trust at DataDome: The AI Control Plane for Managing Your Agentic Traffic
Tell me more

Secure FastMCP with Datadome native (first ever) integration
Tell me more

