


Set out to discover your bot traffic
With DataDome’s new Explore, you can perform a detailed analysis of bot traffic to your website or your mobile API along a dozen dimensions.
As the digital acquisition manager, you create paid campaigns in order to drive traffic to your site and convert prospects to subscribers. For some time now, you’ve observed strong growth in your paid traffic, but your conversion rates are collapsing. What’s going on? With two clicks, the DataDome dashboard displays the list of UTM sources, ranked by number of hits in descending order: Bing stands out with 539 queries, mainly bad bots (Scrapers and Impersonators).
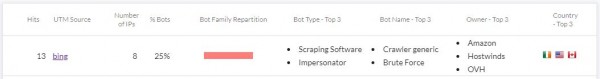
Conclusion: Bots are targeting your Bing campaign, eating your acquisition budget and eroding your conversion rates. You can now take appropriate action to stop the attack and protect your marketing performance.
As the customer data security manager, you closely monitor traffic to your site’s login page to spot any credential stuffing attempts. Suddenly, the server load soars, while Google Analytics doesn’t indicate anything unusual.
With two clicks, the DataDome dashboard displays a list of the URLs on your site that are most targeted by bots. Your login page tops the ranking, with particularly aggressive Russian and US bots.
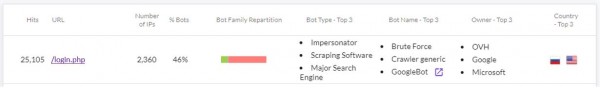
Conclusion: bots are targeting your login page, checking credentials from a stolen database to gain access to your users’ data. It’s time to activate the DataDome protection! Once it’s in place, even new threats will be blocked without any further intervention on your part.
Two use cases, among many others, for the new Explore function in the DataDome dashboard.
A new Explore, what for?
For our customers, installing DataDome marks the beginning of the discovery of largely uncharted territory: the one made up of bot traffic. The journey begins with an overview assessing the scale of this traffic, which is usually equivalent to the visible traffic that standard analytics tools reveal.
It continues with an analysis of the split between different types of bots: Good, Bad, and Commercial. With DataDome’s intelligent and self-learning configuration, the user adapts the settings with a few clicks in order to give access to identified partners, and can then rely on the solution to block access for harmful or unwanted bots.
For some, the journey stops here. But for many others, it’s not enough. Whether the motivation is to understand these threats in order to better prevent them, to learn about the bot ecosystem in order to improve the ROI of the solution, or simple curiosity, most users want to be able to analyze their bot traffic in detail.
Twelve dimensions, hundreds of uses
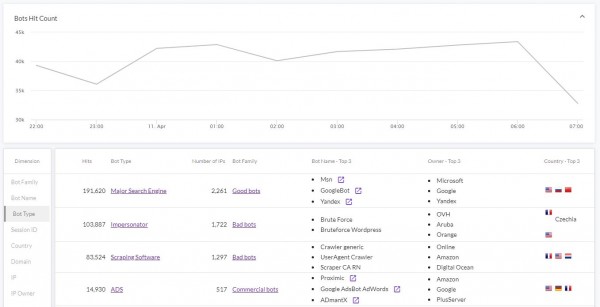 Which countries send the most bots to my site? What types of bots are attacking my mobile API? Which URLs or parts of my site are most often attacked? These questions, and many more, are answered by the new Explore function which is now integrated by default in the DataDome dashboard.
With 12 dimensions to date (Bot family, Bot name, Bot type, Client ID, Country, Domain, IP, IP owner, Segment, URL, User agent, and UTM source), 3 cross filters (Bot family, Bot type, Bot name) and top 3s for all views, this new version opens vast possibilities.
We described two of them in the introduction, and we hope that you’ll find many more with some practice, in order to better protect your user data and to improve your conversion rates and website performance. How about testing (it’s free for 30 days, no obligations) and sharing your impressions and use cases ?
Related posts
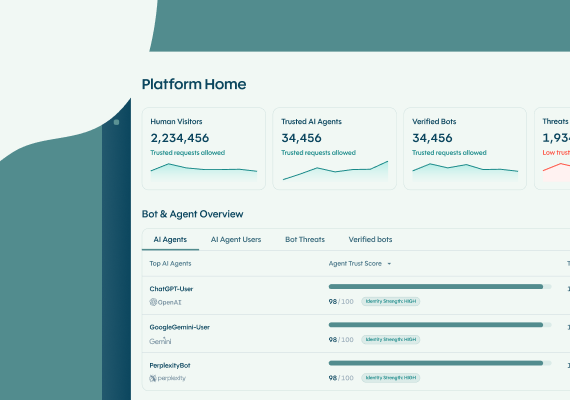
The DataDome Homepage: Your Command Center for Trust & Control
Tell me more
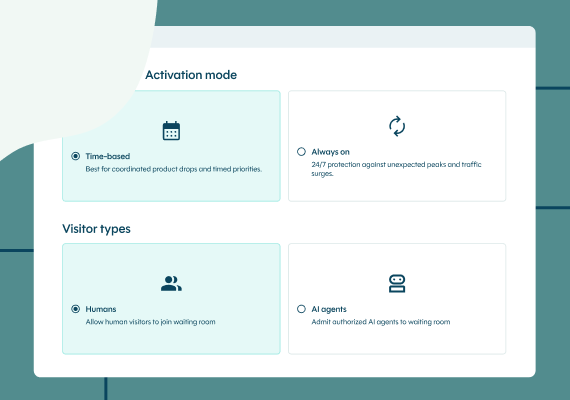
Introducing Priority Protect: The Only Virtual Waiting Room Built for the Agentic Era
Tell me more

Agent Trust at DataDome: The AI Control Plane for Managing Your Agentic Traffic
Tell me more

Secure FastMCP with Datadome native (first ever) integration
Tell me more

