
How to Use Machine Learning to Detect Residential Proxies
Machine learning (ML) is an important tool for scaling sophisticated bot and online fraud protection. One way we apply ML at DataDome is to identify residential proxies.
Residential proxies are increasingly popular among attackers because their IP addresses resemble those of regular, human users. So, the ability to detect whether or not a request originates from a residential proxy significantly improves the quality of detection.
In this guide, we present one of the ML models used by DataDome to classify whether or not a residential IP address was recently used as a residential proxy by malicious bots. But before we dive into ML, we’ll begin with a run-through of the basics.
What is an IP address?
An IP (Internet Protocol) address is a set of numbers that can be seen as a device’s address on the internet. It is used to properly route traffic from a device to a website.
But each device doesn’t necessarily have a unique IP address. There can be one user or thousands of users using the same IP address (or a bot IP addresses) at the same time.
Residential IP addresses provided by ISPs tend to be shared by members of a household, and don’t change frequently. On the other hand, mobile IPs often have thousands of devices with the same address at the same time.
What is a proxy?
A proxy is a program that enables users to change their IP address by routing traffic through someone else’s infrastructure. Proxies can be used by humans for anonymity and privacy purposes, or by malicious bot operators to avoid being blocked.
Indeed, when bot or malicious activity is detected from a given IP address, many online services will block it for a certain duration. To avoid being blocked, bot developers and fraudsters leverage proxies to route their traffic through other IP addresses.
The schema below shows the route taken by an HTTP request, first made without a proxy, and then made with a proxy.
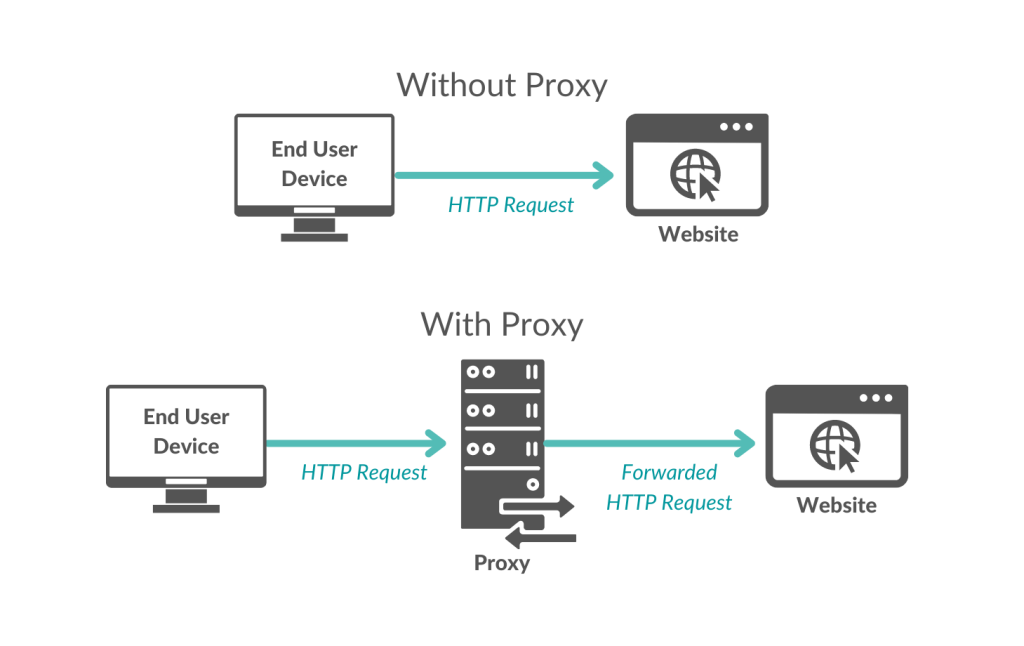
When a user (or a bot) uses a proxy, the request is forwarded by the proxy to the website/mobile application. Thus, for the website, it looks like the request is coming from the proxy IP address instead of the end user’s IP address.
Leveraging behavior-based ML to detect residential proxies:
Why use behavioral signals?
DataDome uses supervised ML to classify whether or not a residential IP address is currently used as a proxy. Although we can use several signals (e.g. networking metrics) to detect residential proxies, the approach we present here will focus on behavioral signals.
The reason we decided to leverage behavioral signals is because most residential proxies are shared proxies used by several bot developers. Although mobile and corporate IPs are also heavily shared, the traffic coming from mobile and corporate IPs exhibits a different pattern than residential proxy traffic.
Each bot developer creates different bots that tend to have different HTTP/browser fingerprints and behaviors. While some bot developers use the proxy in a sticky way (i.e. a sequence of requests from the same bot sent through the same proxy), other bot developers use the same proxy in a rotating way (i.e. each bot request is sent through a different proxy).
Either way, the traffic going out of residential proxy IPs has a different pattern from the traffic of IPs used only by human users.
Note: The difference is not only caused by the volume of requests, it’s mostly caused by the behavior of the IP addresses.
Collecting a Dataset to Train/Evaluate Our ML Model
To train and evaluate our ML model, we created a process to gather a dataset constituted of:
- Residential Proxy IPs (Positive Labels)
- Residential But Non-Proxy IPs (Negative Labels)
1. Collecting Residential Proxy IPs:
To gather residential proxy IPs, we subscribed to several residential proxy providers. We developed programs running on our infrastructure that leverage the proxy providers to continuously make requests through residential proxies to endpoints we control.
Thus, we can flag and store IP addresses linked to the residential proxies that were used by the requests we made. This enables us to have reliable labels as well as to study activity linked to these residential proxies.
The schema below shows the pipeline we built to collect ground truth labels regarding IP addresses used as residential proxies.

This approach enables us to continuously have a fresh set of residential proxy IPs. The good thing about our approach is that we are 100% sure these IPs are residential proxies, since we were able to route HTTP requests through them.
2. Collecting Residential But Non-Proxy IPs:
To build a reliable training dataset, we also need residential IPs that are not residential proxies. Our dataset of negative labels (non-proxies) includes the subset of residential IPs that:
- Do not belong to any proxy provider, AND
- Do not match any residential proxy detection heuristics already in place in our detection engine.
Contrary to the approach we use to collect residential proxy IPs (1), the non-proxy IP approach does not guarantee us to have 100% reliable labels. Indeed, there might still be some residential proxies hidden in this dataset.
However, we make the hypothesis that even if there are some residential proxies hidden in our non-proxy IP dataset, the fraction will be negligible enough not to pollute the model training process.
ML Behavioral Features
We decided to create a supervised ML model leveraging behavioral features because analysis conducted by our threat research team showed that residential proxy IPs had a different behavior compared to IP addresses used only by humans, even when these were shared IPs.
Indeed, we noticed the following main differences:
- Residential proxy IPs contact a lot of different websites protected by DataDome, many of which are located in different countries.
- On average, a session on a proxy IP tends to make few requests on a given website (mostly caused by rotating proxies).
- The traffic from proxy IPs tends to have a lot of distinct user agents.
- The traffic from proxy IPs tends to have a lot of distinct user languages.
These findings make sense, given that the majority of residential proxies are shared between different bots (in addition to the real humans located on the same IP). Since the bot developers want to target different websites, use different user agents, user languages, etc., their outbound traffic looks different from that of a genuine IP address, even when it’s a shared IP.
Thus, we decided to create a supervised ML model that uses the following raw signals aggregated per IP address:
- Number of Requests
- Distinct Number of Websites/Applications Protected by DataDome on Which the IP Made Requests
- Distinct Number of Different User Agents
- Distinct Number of Different Languages
- Median Session Age
Based on these raw signals, we can derive features such as:
- Average Number of Requests Per IP Per Website Contacted
- Ratio: Number of Languages Per User Agent
The table below summarizes the main features used by the ML model:
| Feature | Description |
| Number of Requests/IP | The total number of requests observed from an IP address during a time interval. |
| Distinct Number of Websites/IP | The distinct number of websites/mobile applications protected by DataDome that the IP address made a request to. |
| Distinct Number of User-Agents/IP | The distinct number of user agent HTTP headers observed on the IP address. |
| Distinct Number of Languages/IP | The distinct number of accept-language HTTP headers observed on the IP address. |
| Median Session Age | Median age of DataDome session in seconds. |
| … | … |
| Ratio: Number Accept Languages Per User Agent | Ratio between the distinct number of accept-language values observed on the IP address and the distinct number of user-agent values observed on the IP address. |
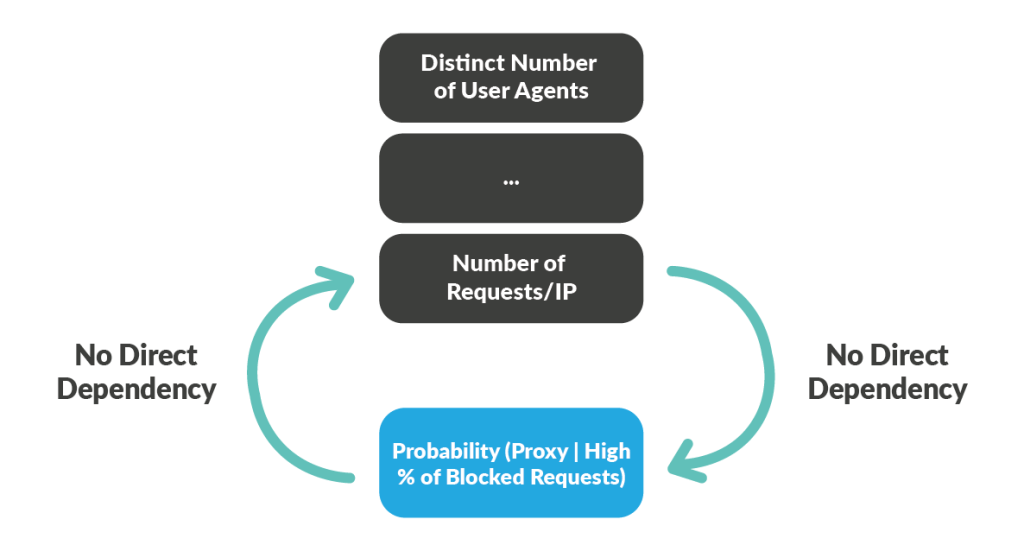
Note that we intentionally avoid using any feature linked to bot detection, such as the distinct number of blocked requests, to avoid creating a self reinforcing feedback loop that could engender false positives in the long term.
If we had used a feature such as the percentage of blocked requests/IP, it would have a significant influence on the model prediction, causing IPs with a high fraction of bot requests to have increased chances of being flagged as a proxy.
Being flagged as a residential proxy would be a problem because it is a negative signal, meaning the flagged IP is more likely to get some of its requests blocked.
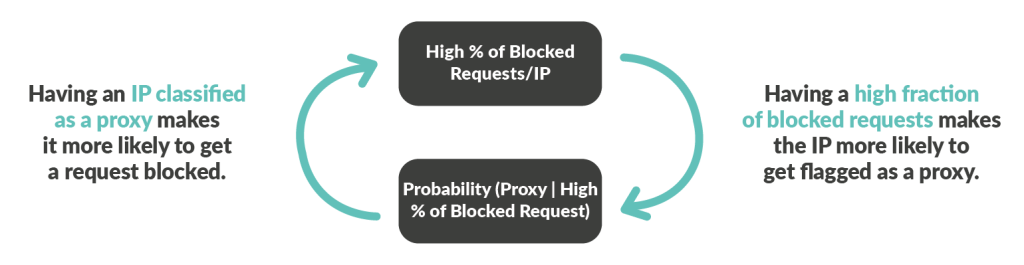
Thus, using features linked to the bot detection itself would have created a negative dependency, which would have polluted the model over time.
By removing the features linked to bot detection, we break the negative dependency.
Model Training
We train our supervised ML model using CatBoost, an open source library, on a subset of our dataset (collected as described above).
We used grid search to determine the best hyperparameters linked to the CatBoost, as well as to infer the optimal parameters of our model. One key parameter is the time window in which we compute the behavioral statistics per IP address.
If the time window is too short, it might be less costly to compute the features, but the performance of the model will be low. On the other hand, having a bigger time window can help improve performance of a model (up to a point), but is more computationally expensive.
After optimization of the hyperparameters, we determined that the best trade-off between computational resources and model performance was 12h.
Model Offline Evaluation
Before a model is deployed to production, we evaluate its performance offline after each training process. Our evaluation process aims to analyze:
- If the model can properly detect residential proxy IPs (optimizing false negatives);
- While not misclassifying human residential IPs (optimizing false positives).
We use AUC (area under the curve) to evaluate the performance of our model.
Model Inference in Production
We have implemented a dedicated service that leverages the ML residential proxy model to continuously infer whether or not residential IP addresses have recently been used as a proxy based on their recent behavior (in the last 12 hours).
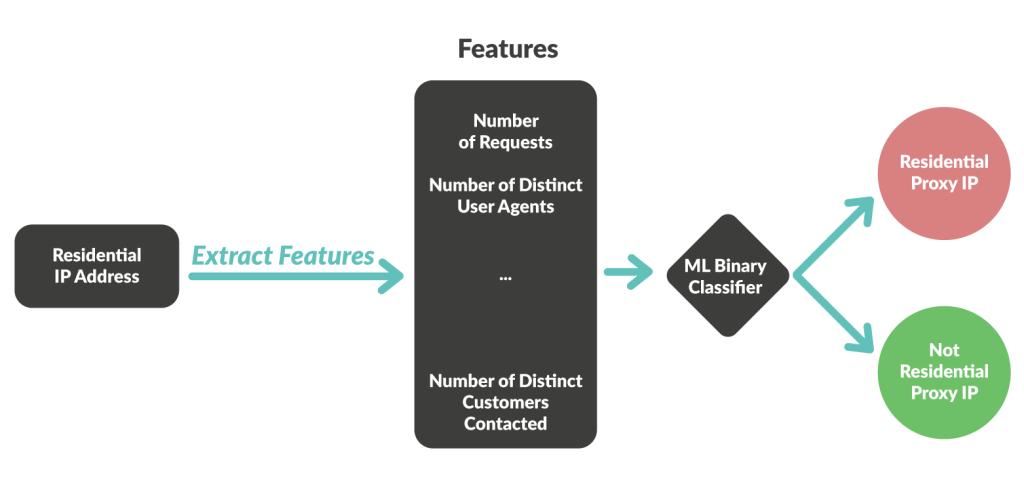
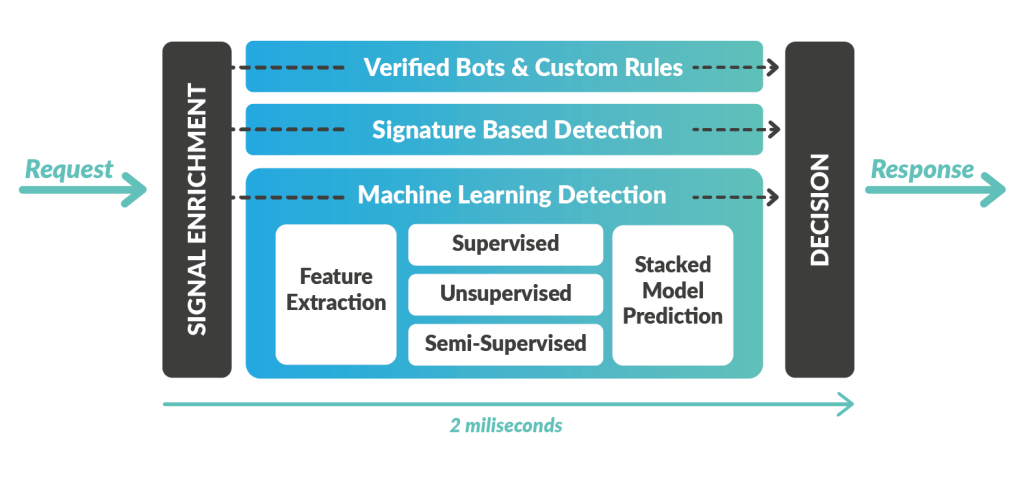
Whenever an IP address is flagged as a residential proxy, we store the information in a database that is continuously read by our detection engine. Thus, our detection engine benefits from the new information for each new request it analyzes in real time.
New information is added to all requests from flagged IPs during the signal enrichment stage in our detection engine (shown in the schema below). From there, the news that the IP address was recently classified as a proxy becomes a signal to all other detection ML models and rules to adjust their aggressiveness.
Residential Proxy IP Retention Period
Once an IP has been flagged as a residential proxy by our ML model, it’s also important to determine how long it should remain flagged as a proxy. We call that parameter the retention period.
Information about IP addresses is not static. For one thing, there are several users behind most IPs addresses. Moreover, residential IPs tend to be dynamically reassigned, which means that a genuine user could obtain an IP address that was recently flagged as a proxy.
Thus, If we keep an IP address flagged as a residential proxy for too long, we run the risk of increasing false positives. On the contrary, if we don’t flag the IP for long enough, we run the risk of increasing false negatives.
Fine-tuning the retention time to obtain the best tradeoff between false positives and false negatives (further explored in the next section), we have determined a retention period of three days supports the best balance.
Note: If an IP address is re-flagged within the three-day retention period, its retention period is extended by three more days.
Online Model Monitoring and Model Retrain
The two main ML metrics we monitor are:
- False Negatives (Easy)
- False Positives (More Difficult)
1. Monitoring False Negatives
Monitoring false negatives is straightforward. We infiltrate several proxy providers so we can measure how good our model is at flagging the IP addresses linked to the proxies we routed our requests through.
False Negatives (FN) = Number of Residential Proxy IPs Wrongly Classified as Genuine Residential IPs / Number of Residential Proxy IPs
2. Monitoring False Positives
Monitoring false positives online is more difficult. Indeed, if we flag a residential IP address as a proxy and no other ML model or heuristic flagged it as a proxy before, it either means that our ML residential model is good and discovered a new proxy, or that it made a mistake. Since we can’t directly know if the IP is actually a proxy, we have no reliable way to measure the direct false positive rate. However, there is a metric correlated with the false positive rate that we can measure.
The idea is to compute whether the false positive rate engendered by blocking decisions made using the labels generated by our ML residential proxy model are better or worse than blocking decisions made using the ground truth labels (IPs we know are proxies). To do that, we flag all residential IPs recently used as proxies by each residential provider we infiltrate with a tag Tproxy_provider_i.
Then, we define a set of blocking patterns that block suspicious traffic also flagged by a proxy provider tag and that match simple signatures. We define the following set of blocking patterns for each proxy provider we infiltrate:
Blocking pattern proxy provider A (BPa):
- Signature1 AND Tproxy_providerA
- Signature2 AND Tproxy_providerA
- Signature3 AND Tproxy_providerA
- …
- SignatureN AND Tproxy_providerA
Blocking pattern proxy provider B (BPb):
- Signature1 AND Tproxy_providerB
- Signature2 AND Tproxy_providerB
- Signature3 AND Tproxy_providerB
- …
- SignatureN AND Tproxy_providerB
…
Blocking pattern proxy provider Z (BPz):
- Signature1 AND Tproxy_providerZ
- Signature2 AND Tproxy_providerZ
- Signature3 AND Tproxy_providerZ
- …
- SignatureN AND Tproxy_providerZ
Thus, we have Z distinct sets of blocking patterns linked to each proxy provider. They all use the same blocking signatures. The only difference is that each set of blocking patterns (BPi) is only applied to IPs flagged as proxies that belong to a given proxy provider (PPi).
Similarly, we create another set of blocking patterns linked to IP addresses flagged as residential proxies by our ML model:
Blocking patterns ML residential proxies (BPml):
- Signature1 AND Tml_proxy
- Signature2 AND Tml_proxy
- Signature3 AND Tml_proxy
- …
- SignatureN AND Tml_proxy
This set of blocking patterns uses the same signatures as the blocking patterns linked to residential proxy providers. The only difference is that it only applies to IP addresses flagged as residential proxies by our ML model.
These blocking patterns are applied on a fraction of traffic. For each set of blocking patterns (BPi), we monitor the CAPTCHA passed rate using the following formula.
CAPTCHA Passed Rate = Number of CAPTCHAs Passed by Requests Blocked by BPi / Number of Requests Blocked by BPi
Thus, we collect the following performance data:
| Blocking Pattern | CAPTCHA Passed Rate | Time |
| BPa | 0.0000373333 | t0 |
| BPb | 0.0000134363 | t0 |
| … | … | … |
| BPz | 0.0000514961 | t0 |
| BPml_proxy | 0.0000238363 | t0 |
| … | … | … |
| BPa | 0.0000253633 | tn |
| BPb | 0.0000237313 | tn |
| … | … | … |
| BPz | 0.0000424431 | tn |
| BPml_proxy | 0.0000312343 | tn |
At a given time (t_i), we want to test the performance of our model between t_i and t_{i-j}, where {j} is the duration on which we want to measure the model.
We conduct Z (number of proxy providers) statistical tests to measure whether or not, for each of them, the performance of our ML model is significantly different from that of the proxy provider. The statistical test we use is a Student’s test, also called t-test, which helps us measure if two sets of data (here the CAPTCHA passed rate linked to a proxy provider and the CAPTCHA passed rate linked to our ML model) have a statistically significant difference in mean.
To conduct each t-test, we use 2 sets of data:
- CAPTCHA Passed Rates Linked to the ML Model Between t_i and t_{i-j}
- CAPTCHA Passed Rates Linked to the Proxy Provider Between t_i and t_{i-j}
Thus, at each time (t_i), we can compare how our ML model compares to the ground truth between t_i and t_{i-j}.
When performance of the ML model starts to degrade, the model performance will typically be worse than the ground truth. Here, it triggers an alert to automatically retrain the ML model based on more recent data, using the same process as described earlier in the “Model Training” section.
The graph below shows the evolution of the CAPTCHA passed rate, which we use to estimate the false positive performance for the ML residential proxy model (green line) vs. proxy provider A (yellow line).

We show that on average, blocking patterns that leverage the prediction of our ML residential proxy model engender fewer CAPTCHAs passed than blocking patterns linked to proxy provider A. That means there is no significant difference in the quality of the labels generated by our ML model versus the ground truth labels obtained by routing requests through residential proxies.
Note: The fact that the CAPTCHA passed rate is lower with our ML model labels, compared to the ground truth labels, doesn’t mean our model is better than the ground truth. Labeling an IP as a proxy is only part of the bot detection process. IP addresses can be shared between humans and bots; they can also be reassigned to humans more or less frequently. Both factors can influence the probability of generating a false positive.
Results
Our supervised ML residential proxy model has been running in production for ~a year. The graph below shows information about the number of IP addresses processed by our ML model over time (with data aggregated per hour).
- Blue line: the total number of residential IPs addresses flagged as proxy by our ML model at a given time (taking into account the three-day retention period).
- Green line: the number of residential IP addresses processed per hour by our model (~350K IPs/hour).
- Yellow line: the distinct number of new residential IP addresses classified as proxies per hour (~35K IPs/hour). Note: We use some caching to avoid reprocessing IPs recently classified as proxy.

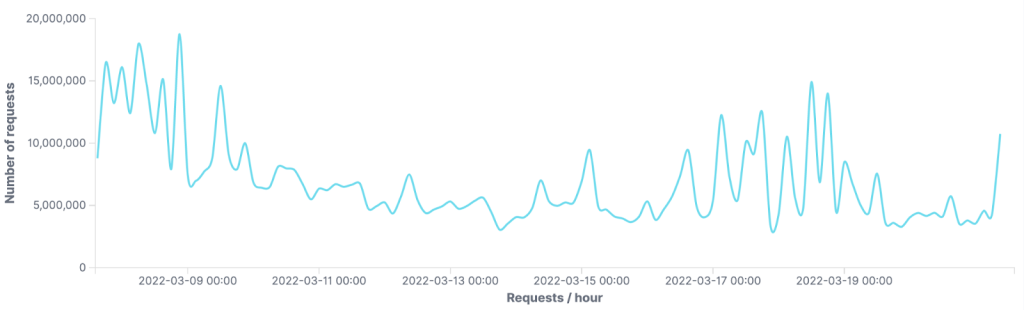
Measuring the traffic blocked due to an IP address being flagged as a residential proxy is challenging. Every day, DataDome’s detection engine processes 1 trillion signals linked to server-side and browser fingerprint, user behavior, IP reputation, and session reputation to make its decisions.
Below shows the evolution over time of the number of requests flagged as residential proxies by our ML model. We see that on average, we block ~7.5M of requests per hour originating from residential proxies flagged by ML.
The table below shows the number of blocked requests linked to residential proxies flagged by the ML model over two weeks, ordered by an autonomous system.
| Autonomous system | Number blocked requests | Country |
| Orange | 96,463,055 | France |
| COMCAST-7922 | 60,140,834 | USA |
| ATT-INTERNET4 | 32,369,010 | USA |
| Free SAS | 24,522,304 | France |
| SFR SA | 21,112,281 | France |
| UUNET | 20,047,784 | USA |
| BACOM | 15,866,747 | Canada |
| ROGERS-COMMUNICATIONS | 15,056,092 | Canada |
| CHARTER-20115 | 13,387,401 | USA |
| Bouygues Telecom SA | 11,947,906 | France |
Our ability to accurately detect residential proxies helps us better protect our customers against sophisticated attacks, such as heavily distributed credential stuffing. The graph below shows the number of requests blocked per hour on the login endpoint of one of our customers.
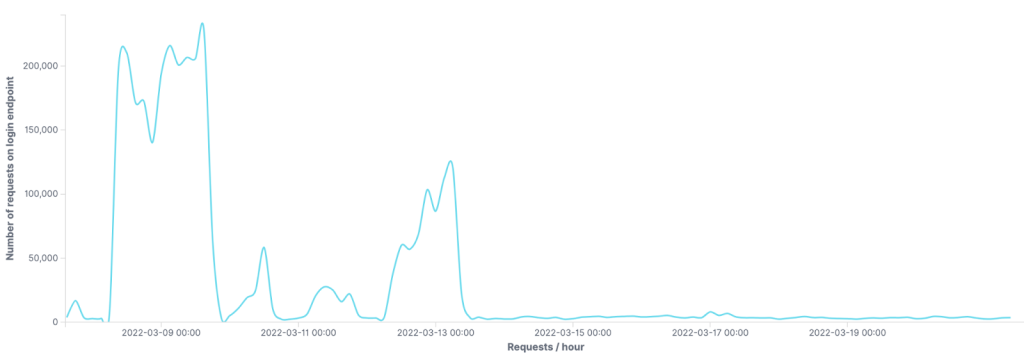
Notice the spikes of blocked bot traffic originating from IPs flagged as residential proxies by the ML residential proxy model.
Conclusion
Machine learning is an essential tool for scaling sophisticated bot and online fraud protection, but creating an effective ML model is not as simple as it may sound. There are many essential steps: choosing the appropriate signals, training your ML model, offline validation, online monitoring, and retraining as needed.
Vigilant threat experts and analysts must review, test, and optimize each ML model on an ongoing basis to maintain a high-performing solution with low false positives and low false negatives.
That’s why it is important to work with a solution provider that has a dedicated, in-house bot SOC team. Hopefully, this deep dive into DataDome’s ML model for flagging residential proxies is an interesting peek behind the curtain of machine learning in bot protection.

Related posts

Beyond Detection Accuracy: Measuring the Real Business Impact of Bot Management
Tell me more

How Effective Is CAPTCHA? Does It Really Stop Bots?
Tell me more

How Much Fraud Is Your Bot Vendor Missing? One Real-Money Gaming Platform Found Out the Hard Way
Tell me more

Fake Account Creation: How to Detect, Prevent, & Protect Against Fake Accounts
Tell me more